
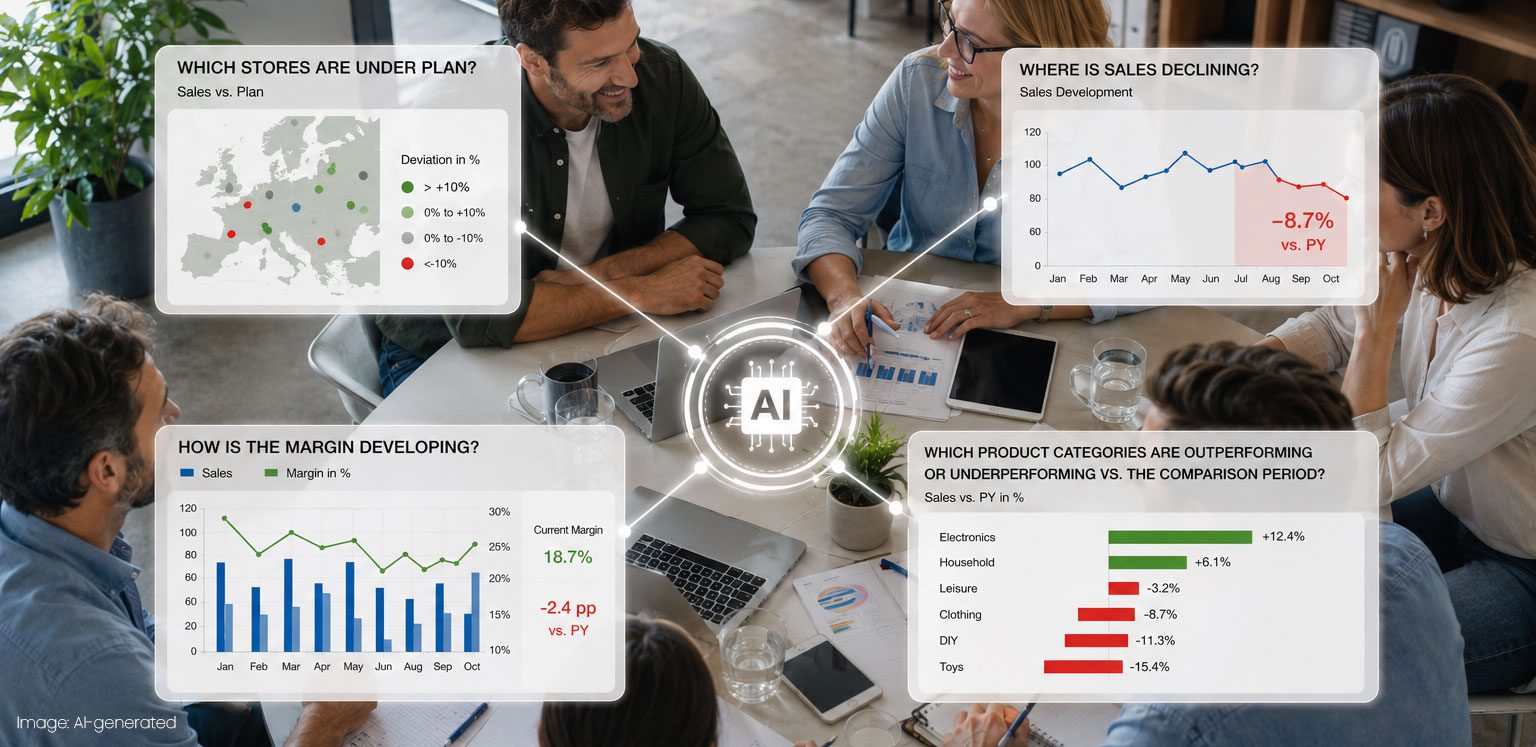
AI can already answer an astonishing number of questions about business data. Comparing sales, identifying anomalies, summarising trends or explaining relationships – much of this is technically possible today. And that is precisely where a new challenge arises. Because just because we can answer a question with AI does not necessarily mean that we should.
Let’s take an example from retail. A company operates several stores and wants to know every morning how each location is performing:
- Which stores are below target?
- Where are sales declining?
- How is the margin developing?
- Which product groups stand out compared with the reference period?
The necessary data is already available in Microsoft Dynamics 365 Business Central and LS Central. Of course, we could connect an AI solution and ask: “Which stores are currently performing worse than expected?” The AI could give us an answer. But perhaps there is a much better solution for this particular task.
Some Questions Don’t Need to Be Asked at All
In our example, we already know exactly what information we need. We know the relevant KPIs, the stores and the comparison periods. We also know when a deviation becomes significant. And most importantly, the question itself does not fundamentally change every morning. This is exactly what business intelligence solutions such as Power BI are designed for. A regional manager opens their dashboard in the morning and can immediately see how their stores are performing. They can compare locations, review different periods or take a closer look at individual product groups. There is no need to formulate a question. The information is already there. At first, that may sound like a small difference. In everyday work, however, it can be crucial. If I need the same five KPIs every morning, I may not want to have a conversation with a system about them. I want to open my dashboard and know within seconds where I need to take a closer look. After all, an answer does not become more valuable simply because it comes from AI.
For Known Questions, Consistency Has Real Value
With a Power BI report, we define very precisely how a KPI is calculated.
- Which data is included?
- Which period are we looking at?
- How do we calculate sales, margin or variance from target?
Once this logic has been defined, it is applied consistently according to the same rules. If ten regional managers look at the same KPI in the morning, it is based on the same calculation logic for all of them. And if someone wants to know why a figure looks the way it does, they can trace how it was calculated. AI works differently. If we ask an AI the same open-ended question twice, the answers do not necessarily have to be identical. They may be phrased differently, emphasise different aspects or – depending on the question and implementation – arrive at different interpretations. That is not automatically a disadvantage. But it is a characteristic that needs to suit the task.
If I want to know the margin of a particular store last month, I probably do not want an interpretation. I want a clearly defined figure that is calculated according to the same logic today as it will be tomorrow. If, on the other hand, I want to understand the possible reasons behind an unusual change in margin, that is a different matter.
More Possibilities Often Mean More Preparation
An AI application often does more than simply display a predefined KPI. It is expected to interpret information, identify relationships or respond to a variety of questions. But that also requires a different foundation. Data also needs to be understood, structured and prepared properly for a dashboard. Without a solid data foundation, Power BI cannot produce reliable insights either. An AI application, however, often adds another layer.
As soon as AI is expected not just to display information but to interpret it, it also needs to understand the necessary context.
- What does a deviation mean in our company?
- Which pieces of information belong together?
- Which rules and exceptions need to be considered?
In the previous article in this series, “Why Many Companies Aren’t Ready for AI Yet”, we looked at exactly this issue: AI does not automatically understand these relationships. In practice, this can mean that an AI solution requires additional preparation. And that is precisely why this additional effort should also deliver additional value.
The More Interesting Question Often Comes Afterwards
Let’s stay with our example. Power BI shows us that the margin at one store has been performing worse than at comparable locations for several weeks. At this point, we know what has happened. The next question is: Why? Perhaps the product mix has changed. Perhaps high-margin products have been unavailable more often. Perhaps there have been an unusually high number of discounts, or returns are developing differently from those at comparable locations. Or perhaps there is a connection that no one has considered yet. At this point, the task changes. We no longer simply want to look at a predefined KPI. We want to connect information, interpret anomalies and investigate possible explanations.
And This Is Exactly Where the Additional Effort of AI Can Pay Off.
In this example, Power BI shows us where we should take a closer look. AI can then help us take that closer look.
The Best Solution Isn’t Always the Most Hyped
Perhaps that is one of the insights that can easily get lost in the current enthusiasm around AI. If a Power BI dashboard provides regularly needed information in a transparent, reliable and traceable way, it does not suddenly become a worse solution simply because AI could theoretically answer the same question. For a clearly defined KPI, that very reliability may be the decisive advantage. Equally, there are situations where predefined reporting reaches its limits. When questions vary, information needs to be interpreted or relationships need to be explored, AI can open up possibilities that a traditional dashboard simply cannot offer in the same way.
Sometimes we need a figure that is always calculated according to the same logic. Sometimes we want to spot a trend at a glance. And sometimes we want to understand why we are seeing that trend in the first place. The key question, therefore, is not which technology gets more attention or promises more possibilities. What matters is which capabilities we need for the task at hand.
The best solution isn’t always the most hyped. It’s the one that delivers the greatest value in the right place.
Sometimes that is Power BI. Sometimes it is AI. And in many cases, the two will complement each other very well. Because just because AI can do something does not necessarily mean that AI should do it.